Dashboards
While VisualCortex provides comprehensive Integrations for data analysis using third party Business Intelligence tools, there is an ability to create Dashboards in the platform.
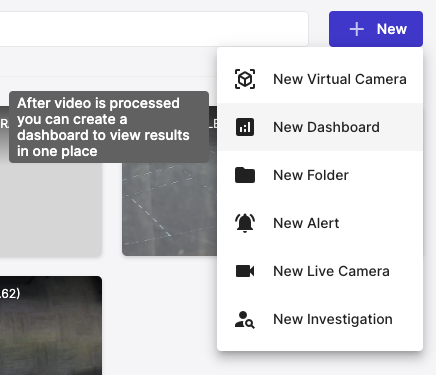
To create a dashboard, simply click New in a folder, and select New Dashboard. Dashboards can have their own Permissions, so you can grant access to them without granting access to the underlying cameras.
Dashboards work with both Live Cameras and Virtual Cameras. If data is present in the VisualCortex Control Plane analytic data store, it can be reported on here.
Creating charts
Dashboards are made up of Charts. You can add charts by clicking on the [+] icon in the Dashboard itself. You'll be presented with a chart selection page similar to this:
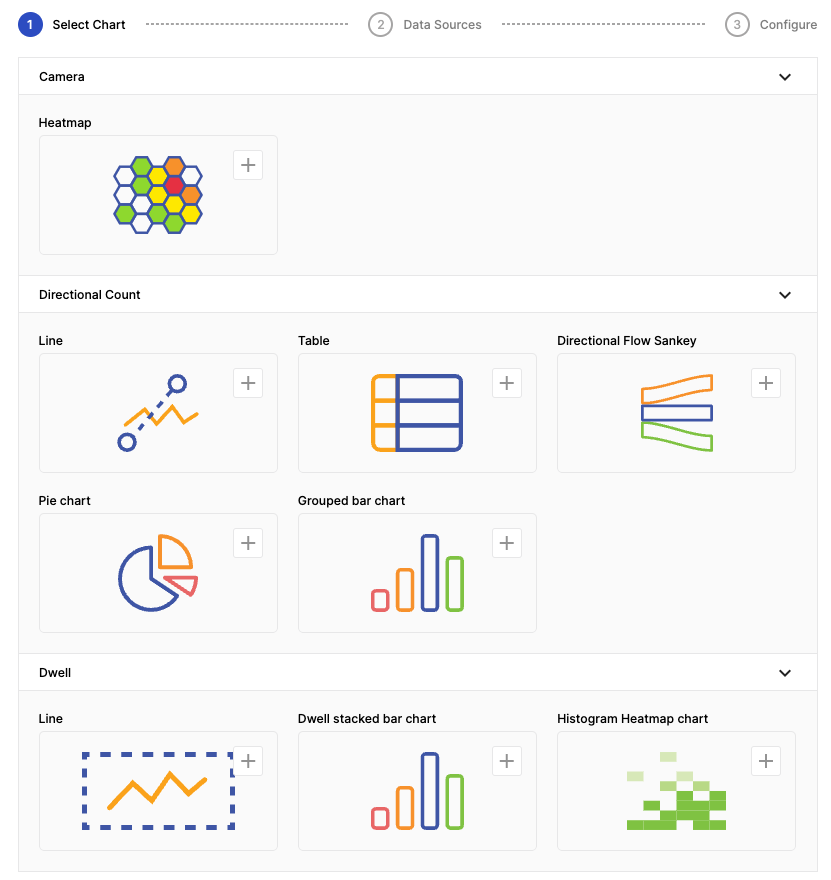
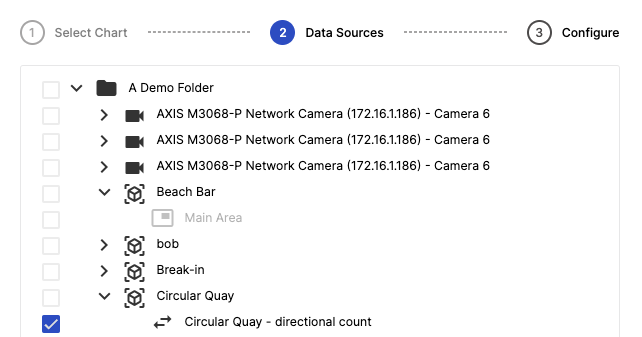
Choose a chart suitable for what you're wanting to report on. Every chart will ask you to select a data source. This is typically one or more Event Definitions, but could also be a camera.
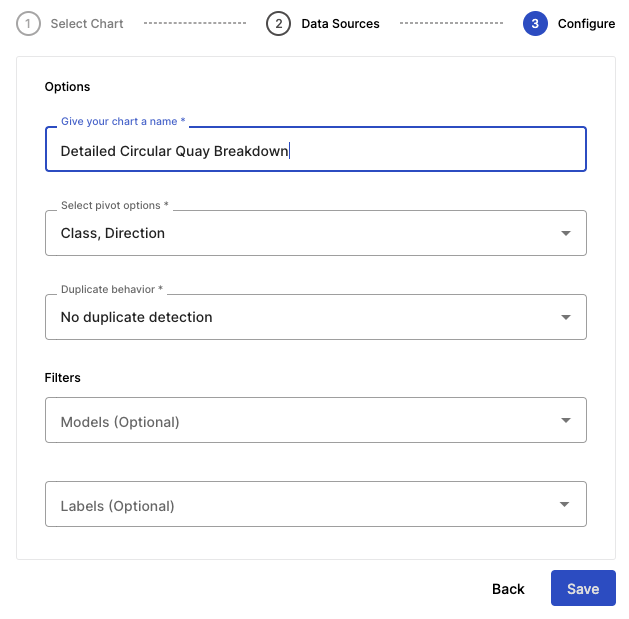
Lastly, you'll get the chance to configure any options that a specific chart needs. This differs per type of chart.
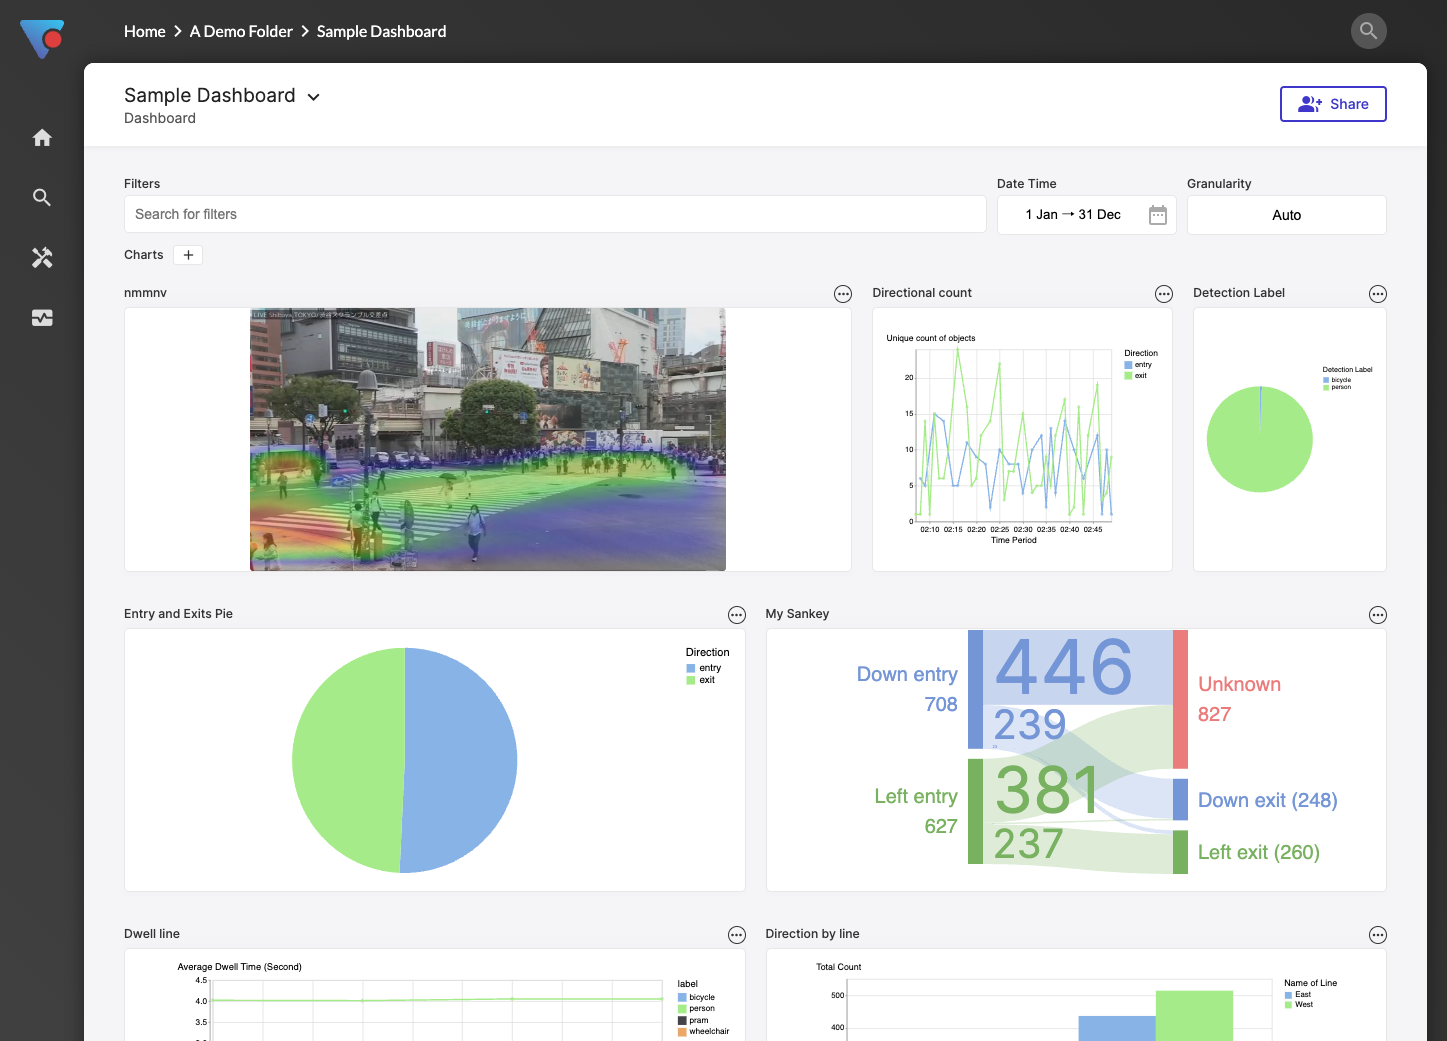
After charts have been created, you can easily move and resize them. Move by dragging the chart. Resize by dragging the resize icon in the bottom right-hand corner of the chart.
You can filter an entire dashboard by using the filter controls at the top of the Dashboard. There is also a Granularity drop-down, which allows you to specify how granular you want your reports (eg. Minutely, hourly, daily etc.)